In this topic: Finding allocations in the Profit and Loss by Class report (QuickBooks) Finding allocations in the Profit Analysis report (ManagePLUS Gold) |
After sending Journal Entries to QuickBooks you can see their effect in the Profit and Loss by Class report. Or, you can use the Profit Analysis report In ManagePLUS Gold, which offers some unique advantages.
Finding allocations in the Profit and Loss by Class report (QuickBooks)
| 1. | Choose Reports > Company & Financial > Profit and Loss by Class from the QuickBooks main menu. |
| 2. | Set the report's date range to match the accounting period you are working with. |
| 3. | Scroll down to the bottom of the report and look for the Allocated Expense (MP) section, indicated by the green bracket in the screen shot below. |
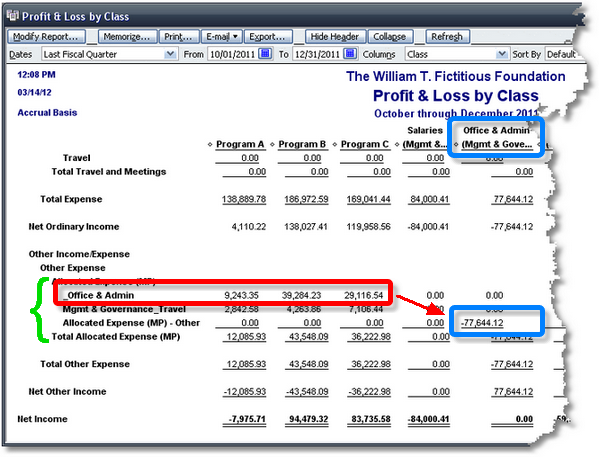
Notice that the Journal Entries from ManagePLUS Gold have:
| • | Posted allocations to subaccounts of Allocated Expense (MP). Example: Allocations from the Office & Admin class to Program A, Program B, and Program C are shown on the _Office & Admin (subaccount) line, indicated by the red box. |
| • | Posted offset amounts for those allocations to the Allocated Expense (MP) parent account. Example: The blue box shows the Office & Admin offset amount. |
Finding allocations in the Profit Analysis report (ManagePLUS Gold)
ManagePLUS Gold's Profit Analysis report:
| • | Is a profit and loss report for a single class or a "branch" of the of the class tree (a parent class and its subclasses). |
| • | Is available at any time, so you can see the effects of your allocations immediately, without sending Journal Entries to QuickBooks. |
| • | Is created in ManagePLUS Gold's internal spreadsheet. Some report cells are "live": you can change data in them (play "what-if") and immediately see the effect on the entire report. |
| • | Has columns with automatically-generated management statistics, such as showing each expense on a per-staff-hour basis (or other basis, depending on the management quantities you have used). |
| 1. | Choose Reports > Profit Analysis (for a class) from the ManagePLUS Gold main menu. |
The Modify Report dialog will be displayed.
| 2. | On the Filters tab, select the class you want to view in the report. |
Here's an example with the Program C class selected:
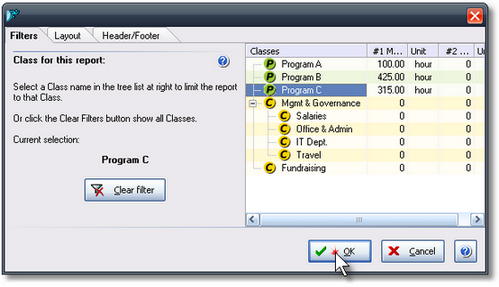
| 3. | Click OK. |
The report will open in a new tab.
| 4. | Scroll down to the bottom of the report and look for the Allocated Expense (MP) section, indicated by the green bracket in the example below.. |
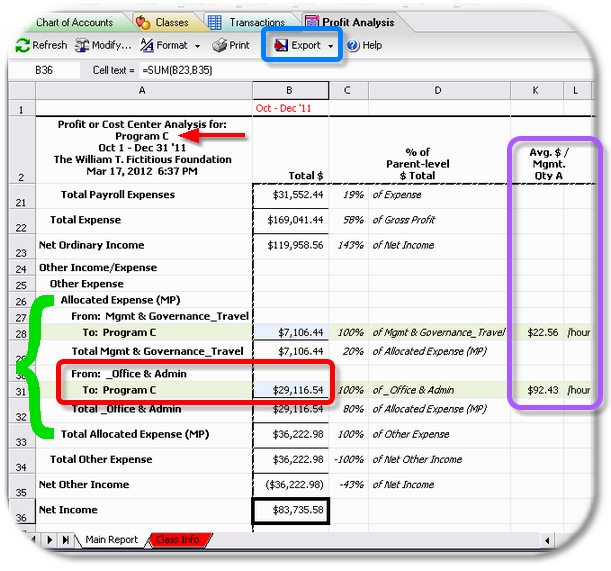
Things to notice:
| • | This report is for the Program C class, as indicated by the red arrow. |
| • | The allocation of Office & Admin expense to Program C is shown in the red box. |
| • | Several optional report columns are available to include in the report, many of which automatically calculate various statistics. The purple box illustrates one of them: it shows every expense line on a per-management-quantity basis. In this example we associated a number of staff hours with each program class, so the $92.43 amount is the Office & Admin expense per staff hour for Program C. (For details, see Assigning management quantities in the First-Time Setup section.) |
| • | Like QuickBooks reports, ManagePLUS Gold's reports can be exported to Excel if you want to make changes or additions (the Export button in blue box). |