In this topic: Getting a yield summary by class (all class levels) Getting yield by farm, crop, crop year |
Now the fun begins. Let's see how easy it is to get some yield information out of this set of example records.
We will be using visual features of the Transaction window's grid to rearrange, group, sort, and filter records, to get at the information we want. We call them "visual" features because they let you control the window visually—by just clicking and dragging items with the mouse. Here's a quick reference to some of those features:
We will be using some of the Transactions window's visual features to rearrange, group, sort, and filter records, to get at the information we want. We call them "visual" features because they let you control the window visually—by just clicking and dragging things with the mouse. Here's a quick reference to some of those features:
![]()
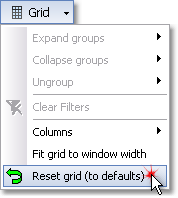
When trying out all these possibilities you might get the transactions window's grid rearranged in such a way that it's hard to figure out what you've done or how to "get it back the way it was". If that happens, there's an easy fix: use the Reset to default view command in the Grid button menu. It will reset all of your grid changes and settings:
Getting a yield summary by class (all class levels)
ManagePLUS lets you drag column heading(s) into the grouping panel, to group and summarize transactions by the contents of that column.
In ManagePLUS:
| 1. | Go to the Transactions window by clicking on its tab. Or if it isn't open, click on the Trans' button in the toolbar or choose Lists > Transactions from the main menu. |
![]()
| 2. | Drag the Class column heading into the grouping panel. |
That is, click on the Class column's heading and hold down the mouse button. While still holding down the mouse button, drag the column heading upward into the grouping panel, then release the mouse button.
While dragging the column heading, green arrows show where it will be placed if you release the mouse button:
![]()
After you release the mouse button, the window should look like this
![]()
Because the Class list has multiple levels, ManagePLUS has split them into separate groupings: Class1...Class5.
| Grouping is the ManagePLUS term for dragging a column heading into the grouping panel as you've just now done. It arranges transactions into groups and summarizes each group. We'll most be grouping by Class in this example, but in financial transactions or a more complex set of records you could group by any column heading or, in fact, by several different column headings at once. |
| Why are the Class headings colored light blue? Grouped headings like Accounts and Classes are colored to match their corresponding data window's tab color. |
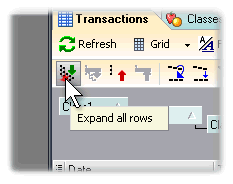
| 3. | Click the Expand all rows button in the Transactions window toolbar. |
The window's contents should look something like this, with all groups expanded:
![]()
Looks a bit messy, huh? There's too much detail here for easy viewing. You can control how much detail is showing by a couple different means. One is to use the ![]() and
and ![]() buttons visible at each grouping level, to expand or collapse individual levels.
buttons visible at each grouping level, to expand or collapse individual levels.
|
How average yields are calculated at higher group levels... When you group transactions, ManagePLUS accumulates production and acreages upward from lower (child) to higher (parent) class levels. In other words, average yields calculated in parent groups are based on the accumulated acreages from their child groups. This only happens only so long as the parent group has the same production/use unit of measure assigned to it (acres in this case) as all of its child groups. |

| 4. | Use the |
Here's an example, with various sections expanded or collapsed to show per-farm and overall corn yields for 2008, but only overall corn yields for 2007.
![]()
Another thing you can do to reduce clutter is to hide columns you don't want or need. Let's hide the Amount and Account columns, since neither is important for viewing yield records.
| 1. | Click the Column selection button in the upper left corner of the grid, to display list of all currently-available columns. |
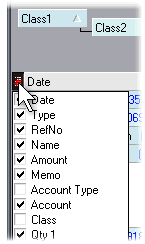
| 2. | Un-check the Amount and Account columns. |
When you do, they will immediately disappear from the grid display.
| You can show or hide any column by checking or un-checking it in this list. |
Getting yield by farm, crop, crop year
Maybe the most important thing about being able to group transactions in ManagePLUS, is that it lets you treat each grouping level as independent of the others. This means you are no longer "stuck with" the structure of your Class list (or any other QuickBooks list supported by the current ManagePLUS version) for reporting purposes. You can rearrange the structure to suit your needs.
In the following steps you will rearrange the grouped class levels to get a report of yields by Farm and by Crop Year, even though Crop Year is at a higher level in the Class list.
In ManagePLUS:
These instructions assume you are continuing on from the steps above, with transactions grouped by Class1...Class5 levels.
| 1. | In the grouping panel, drag the Class3 heading to the left of the Class1 heading. |
![]()
Class3 is the heading level corresponding to Farm location, which means transactions are now grouped in this arrangement:
Farm/Location |
||||
|
Crop |
|||
|
|
Crop Year |
||
|
|
|
Field ID |
|
|
|
|
|
Variety |
| 2. | Click the Expand all rows button in the Transactions window toolbar. |
| 3. | Use the groups' |
Here's a partial view showing 2007, 2008, and 2009 yields for Jones farm Corn (all Field ID levels have been collapsed).
![]()
Next, let's arrange yield by Farm, Crop Year, and then by Crop...
| 4. | Drag the Class2 heading to the left, placing it between the Class3 and Class1. |
![]()
Class2 is the heading level corresponding to Crop Year, so the transactions are now grouped this way:
Farm/Location |
||||
|
Crop Year |
|||
|
|
Crop |
||
|
|
|
Field ID |
|
|
|
|
|
Variety |
| 4. | Click the Expand all rows button in the Transactions window toolbar, as you did in step 2. above. |
| 5. | Use the groups' |
Here's a partial view showing Jones farm yields again, but this time by Crop Year and by Crop within each Crop Year (like before, all Field ID levels have been collapsed to reduce detail).
![]()
Sorting the transactions by any column is easy.
| • | To sort by any column, click once in the middle of its column heading. |
| • | To sort in reverse order by that column, click its column heading a second time. |
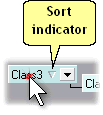
| A small triangle called a sort indicator appears toward the right edge of the column header you've sorted by, to indicate the sort direction (forward or reverse order). |
Clicking a column heading to sort by that column even works for column headings in the grouping panel, as we'll demonstrate now. Let's continuing on from the prior steps, with the Transactions window grouped by Farm, Crop Year, and Crop (Class3, Class2, Class1)
| 1. | Click the Expand all rows button to fully expand all groups. |
| 2. | Click in the Class3 heading in the grouping panel. |

Notice how the sort order of the Crop Year grouping level changes.
| 3. | Click in the Class3 heading again. |
Now the sort order of the Crop Year grouping level changes back to the way it was.
Filtering means to limit what records are shown. Let's continue on from the prior steps, filter the records to show only those for the 2007 crop year.
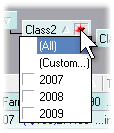
| 1. | Click the Column filtering button of the Class2 column heading. |
The Column filtering button appears when you hover the mouse cursor over any column heading. Clicking the button shows a list of all the available data values for a column, like this:
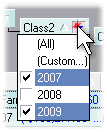
| 2. | Click on the 2007 item in the drop-down list. |
When you do, the grid is immediately redrawn to show only records for 2007.
| 3. | Click on the 2009 item in the drop-down list. |
Now records for 2007 and 2009 are displayed. To verify this, scroll around in the grid a bit and have a look.
| You can check mark as many items in the list as you want, or even check mark filter items in other columns as well, to get really specific about what records are displayed. |
| 3. | Click the Column filtering button if the drop-down list isn't still visible. |
| 4. | Click on the All item in the drop-down list to remove the column's filter (show all records). |
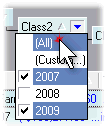
Now all records are displayed.
Getting yield statistics for crop varieties
If you've grouped transactions by a multi-level QuickBooks list such as the Classes list, besides changing the order of levels you can also remove some levels from the grouping panel to simplify the view.
In the following steps you will show yield statistics by crop Variety (the Class5 level), plus removing some class levels to make for easier viewing.
In ManagePLUS:
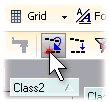
| 1. | Click on the Remove all grouping button in the Transactions window toolbar, so we can start afresh. |
| 2. | Drag the Class column heading into the grouping panel, as we did before in an earlier step. |
Here's how the Transactions window should look after you've done this.
![]()
We want to see yields by variety but Variety is the lowest class level (Class5), so we need to move it to the top of the class structure.
| 3. | In the grouping panel, drag the Class5 heading to the left of Class1. |
![]()
| 4. | Click on the group row that reads Garst 8422GT so that the row is highlighted, like this: |
![]()
| "Why didn't we click on the first Variety row? Why is it blank?" If you expanded that first row to see the transactions in it, and looked them up in QuickBooks, you would see that they are assigned classes like Corn:2008:Smith Farm:2-140. That is, they indicate a Field ID but not a particular Variety. That's why the first grouping row is blank. |
| 5. | Click on the Expand selected rows button in the Transactions window toolbar, to expand the detail for only the selected (Garst 8422GT) row. |

As before, there's still more detail showing than we want to see. Let's get rid of the Crop (Class1) class level—a corn hybrid or soybean variety is specific to only one type of crop anyway, so we don't need that information.
| 6. | Drag the Class1 heading out of the grouping panel, down among the other column headings (anywhere will do). |
![]()
When you release the mouse button ManagePLUS will ask if you want to ungroup all class columns or just the Class1 column.
| 7. | Click the Just Class1 button. |
![]()
The Class1 heading will now appear among the other column headings, instead of in the grouping panel.
We can also get rid of the Farm (Class3) and Field ID (Class4) grouping levels. (They'd only be necessary if we wanted to compare varieties' yields on different farms and in different fields.)
| 8. | Drag the Class3 and Class4 headings out of the grouping panel (one at a time), down among the other column headings as you did for Class1 in step 6 above. |
In each case when ManagePLUS asks if you want to ungroup all Class columns or just the Class3 or Class4 column, choose to ungroup just the single column.
| 9. | Click the Expand all rows button. |
| 10. | Collapse the first row (the one with the blank or empty Variety name) by using its |
You may also want to hide the Class1, Class3, and Class4 columns which are now showing among the grid's other column headers. If so...
| 11. | Click the Column selection button, to show the drop-down list of available columns. |
| 12. | Un-check the Class1, Class3, and Class4 columns in this list, to hide them. |
Your Transactions window should now look something like the one shown below. Note that it shows average yield for each variety in each crop year, plus the overall average yield for the variety across all crop years.
![]()
Printing or exporting a report
You can print or export a report from the Transactions window at any time.
In ManagePLUS:
To print a report (optional):
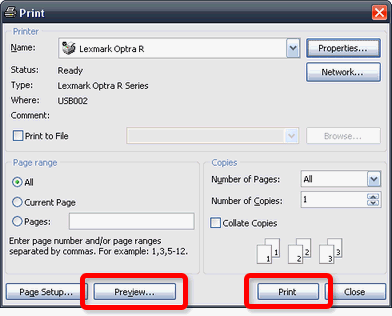
| 1. | Click on the Print button in the Transactions window toolbar. |

The Print dialog will open. From there, you can print or preview a report for the Transactions grid.
To export a report (optonal):
You can export a copy of the Transactions grid to any of several file formats: .XLS (Microsoft Excel), .HTML, .XML, or text (tab-delimited).
| 1. | Click on the Export button in the Transactions window toolbar. |

| 2. | Choose As HTML file... (or any other format you want to export to). |
A file Save As dialog will open.
| 3. | Enter a file name for exporting to, such as Test.htm, and click the dialog's Save button. |
An Export to export type dialog will open:
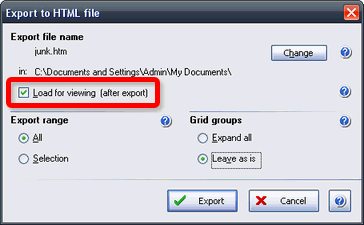
Check mark the Load for viewing (after export) item if you want to see the file immediately after exporting it.
| 4. | Click the Export button to export the file. |
After a slight delay, the file should load into your Web browser. Here's the exported file loaded into the Firefox browser:
![]()
The most important point:
|
You've seen how ManagePLUS makes it easy to summarize, analyze, and get reports on crop yields... But the most important point is that you can do the same kinds of things with your QuickBooks financial transactions as you've done here with an example set of crop yield records! |
Page url: http://www.goflagship.com/help/mp/index.html?wrk_reportsandinfo.htm